Valid: 17-Feb-2026 7:07pm
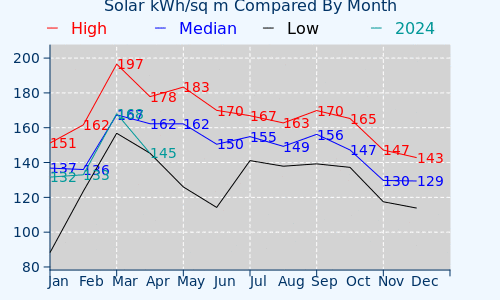
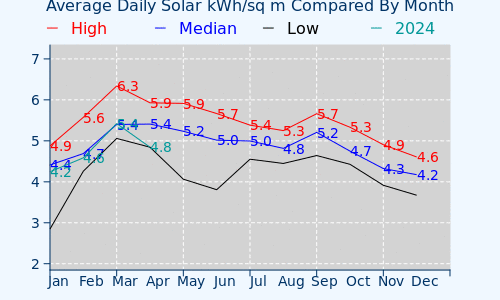
The following charts are based on solar radiation data taken by each weather station. The first chart shows the cumulative high,low, and median kilowatt hours per square meter for each month of the year. The current year is shown through the end of last month for comparison. The second chart shows the same information except as the daily average for each month.


This weather information is derived from usually reliable government and private sources but it is not an official government product. Monitor your local radio station for storm watches and warnings issued by local authorities. We do our best to provide accurate information as a free public service, but we assume no liability for errors.